Convergence of the iPod
24 May 2006Using an iPod to see how fast one is running:
because eloquence is, like, whatever
And what a day it was! It went by in a rush, without any major mishaps and with lots of smiling people all around. Me, I just ran around on adrenaline and cafeine (probably equal parts), while catching only the occasional 5 minutes of a speech here and there. But at the end of the day: it was a great atmosphere with lots of interesting topics and charming people eager to learn and share. It was everything I hoped it would be, so I’m a happy man.
Less than 24 hours to go and 55 people registered!
Some last instructions on how to get to the International Press Center (near Wetstraat/Rue de la Loi):
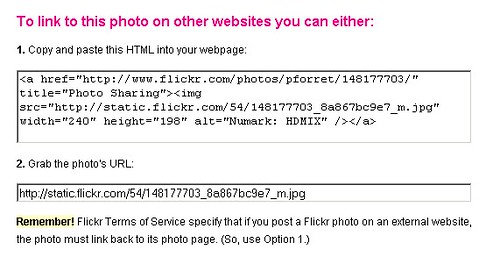
I was doing it anyway, but now Flickr is pissing me off:
Yesterday I was browsing through my freshly arrived Tufte book “The visual display of quantitative information“. One example of “garbage in, garbage out” that he gives is the London Stock Exchange index (which went way down one year in Dec) and the solar radiation in that same year (which obviously also went down in the winter). Plotting both lines in the same graph gives the impression of correlation (Stock Exchange went down because of lack of sun).

Wired just released an article on digital camera technology: why megapixels alone are not a good indicator of camera and photograph quality.
Add one more superlative to Paramount’s “Mission: Impossible: III”: it is the largest digital release ever, playing on more than 170 digital cinema screens throughout North America. And all digital preparation and distribution to those screens was handled by Kodak Digital Cinema.
from http://www.dcinematoday.com/dc/pr.aspx?newsID=487
 I’ve been following the Database War Stories of O’Reilly Radar: how companies use text-based alternatives to classic relational database systems in order to cope with huge volumes. Check out the stories of Findory/Amazon, Google File System, Flickr and Second Life. Anyway, this seemed like a good moment to share some of my database war stories. Let me take you back to the early nineties.
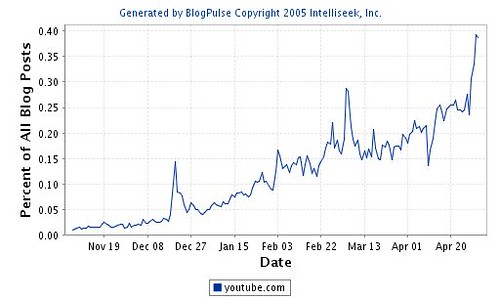
Youtube seems to be losing some of its early adopters: Coolz0r quits the service, while Nathan even embarks on a grassroots activism mission to ruin the company (by getting its most popular uploaders banned – I have mixed feelings about that one). The issue is: to protect themselves from lawsuits, Youtube is taking the approach of deleting videos and even users upon first suspicion of (copyright) problems. They already received an ultimatum from NBC in Feb, then a proof to Jason Calacanis that it was ‘not a real business‘.
